In the State of Pennsylvania, children eligible for Medicaid often fail to receive the care for which they are eligible under Early and Periodic Screening, Diagnostic, and Treatment (EPSDT) benefits.
Coverage is slightly worse than the national average, leaving a great deal of room for improvement in both relative and absolute terms. Even where metrics rank Pennsylvania ahead of most other states, many eligible children do not receive the services and screenings to which they are entitled, negatively impacting their lifelong health.
EARLY AND PERIODIC SCREENING, DIAGNOSTIC, AND TREATMENT BENEFITS
EPSDT benefits provide comprehensive preventive health services for children under the age of 21 who are enrolled in Medicaid. In Pennsylvania, approximately 1.2 million individuals are eligible to receive medical, dental, mental health, developmental services, and specialty services. In addition to these services, children are entitled to screenings including health history, physical exams, immunizations, laboratory tests, and health education. All states receive Medicaid funding and, as such, must make services and screenings available to under 21 enrollees. Yet Pennsylvania and all other states fail to provide services and screenings to patients at the expected levels.
DENTAL CARE
In the case of dental care, Pennsylvania provides services to eligibles at rates much lower than the national average. In 2012, only 40% of all eligibles received any dental services, leaving nearly two-thirds of the children covered by Medicaid without the comprehensive care to which they are entitled. Further, only 35% of those eligible received preventive dental services, unnecessarily exposing children to future dental problems. Pennsylvania finds itself ranked 38 of the 50 states in terms of its dental services coverage, and 42 in terms of its preventive dental services coverage. The national average and rates for neighboring states such as New Jersey and Delaware are all at 42% and 44%, respectively, with 7-9% more eligible receiving preventive dental services.
MEDICAL CARE
Participant Ratio
The Participant Ratio is calculated as the total number of eligibles who receive at least one medical screening that they should receive divided by the total number of eligibles who should receive at least one medical screening. The ratio exposes the percent of children who are not receiving any of the preventive medical care to which they are entitled. In Pennsylvania, the participant ratio is .63, showing that over one-third of all eligible children are not receiving the preventive screenings they need. Although the statistic is regrettable, Pennsylvania’s Participant Ratio is slightly higher than the national average, which is only .59. Though the advantage is small, it represents an important step for Pennsylvania in prioritizing preventive care. However, this left 468,512 eligible children without preventive screenings in 2012 alone. While Pennsylvania is doing better than average, the average leaves far too many participants unscreened.
Screening Ratio
The Screening Ratio is calculated as the total expected number of medical screenings which all enrolled children should have received divided by the actual number of medical screenings received in a given year. The Screening Ratio for Pennsylvania, .77, is lower than the national average, .81, and it is significantly lower than the averages of neighboring states. In New Jersey, the Screening Ratio is .91, and in New York it is .92.
The Screening Ratio seems to be low in Pennsylvania because of dramatic drop-offs in screening rates for children around age 10. Although 100% of expected screenings are received for children ages 6-9, well above the national average, only 53% are received for children ages 10-14, well below the national average. Although screening rates generally decrease as children’s ages increase nationwide, the drop-off is extremely sudden in Pennsylvania and more extreme than in neighboring states. In New Jersey, the screening ratio actually increases from 70% at ages 6-9 to 71% at ages 10-14. In New York, the ratio decreases from 100% at ages 6-9 to 70% at ages 10-14. While New York also represents a dramatic drop-off, it is much less extreme than in Pennsylvania. While the weighted average data is not currently available at a national level for 2012, the national drop-off for 2011 was from 76% to 67% for 6-9 to 10-14. Ensuring that adolescents receive the preventive care necessary at all ages could improve lifelong health while decreasing lifetime health care costs.
COMPARISON OF 2011 AND 2012 EPSDT DATA
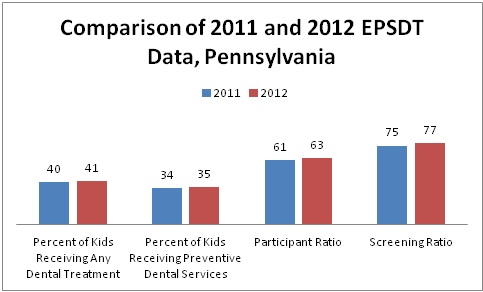
National weighted average data is not currently available for 2012, but looking at this data for 2011 is revealing. As seen in the chart below, the differences between the two years are minor, making 2011 national data still a relevant measure. For Pennsylvania, there have been slight increases of 1-2% in each of the categories (percent of children receiving any dental treatment, percent of children receiving preventive dental services, participant ratio, and screening ratio). These trends indicate slight improvements at the state level for EPSDT services.