A Summary of the 2013 Pennsylvania EPSDT Participation Report
By Romi S.K. Laskin[1]
Since 1967, the Centers for Medicare & Medicaid Services (CMS) Early Periodic Screening Diagnostic Treatment (EPSDT) benefit program has provided children under the age of 21 enrolled in Medicaid with comprehensive and preventive medical and dental care.[2] Eligible children are entitled to periodic examinations by health professionals, as well as screening, diagnostic testing, evaluation, and treatment of physical, mental, developmental, dental, hearing, and vision issues.[3] Federal law requires each state accepting federal dollars through Medicaid to provide EPSDT benefits to all eligible children.[4] Each state is required to submit to the CMS annual data showing the number and percentage of children who received required services.
A recent examination of the 2013 Annual EPSDT Participation Reports, conducted by the Public Interest Law Center of Philadelphia, shows that across the nation, states are failing to meet the basic health service needs of children eligible for EPSDT. Pennsylvania, with over 1.2 million children enrolled, is no exception. Indeed, for most of the reported metrics, Pennsylvania’s performance falls below the national average.[5] Pennsylvania must act to improve its EPSDT participation data, and protect its already vulnerable children from serious potential health problems.
Dental Care
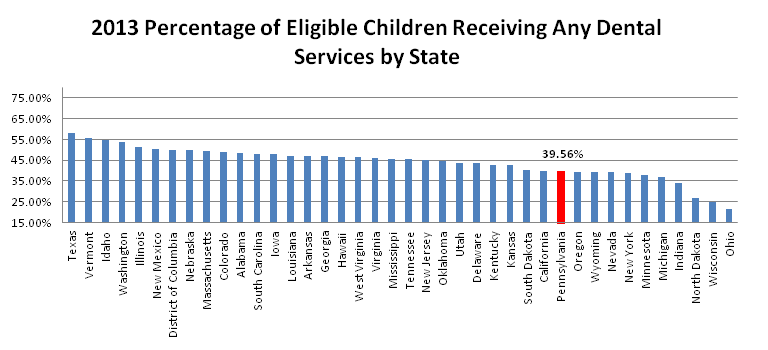
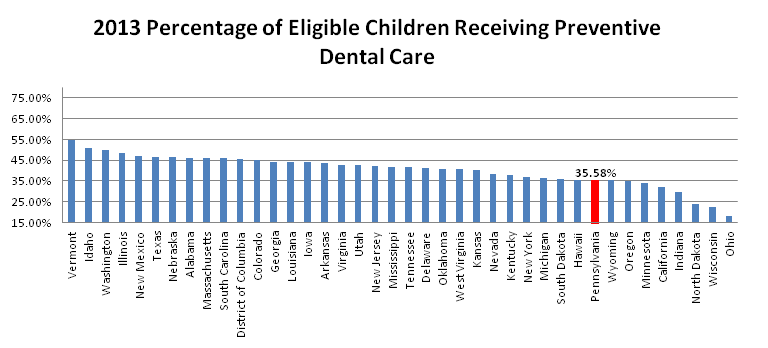
Dental care is an integral aspect of Medicaid’s EPSDT benefit program, and one in which Pennsylvania is failing its children. In the 2013 fiscal year, only 39.56% of children enrolled in Medicaid in Pennsylvania received any dental services, leaving 763,623 children without vital dental care. This percentage is almost a 2% improvement from 2012, but still lags 4% short of the national average. If Pennsylvania had achieved the national average for provision of any dental services, over 50,000 other eligible children would have also received dental services. CMS requires that states provide dental care other than emergency services, but in 2013, only 35.58% of Pennsylvania’s children received preventive dental services.[6] This left 813,846 children without the preventive care that works to minimize serious dental health issues.
The percentage of children enrolled in Medicaid receiving preventive dental care increased by nearly 3% from 2012, but that increase still leaves Pennsylvania more than 3% below the national average. Compared with the 39 other states and districts with published 2013 EPSDT Participation Reports, Pennsylvania ranked 30th in its percentage of children provided with any dental services, and 32nd for dental preventive services. It is about 1% ahead of its neighbor New York, although over 4% behind New Jersey and Delaware for the provision of any dental services. Preventive dental care statistics follow the same pattern, with Pennsylvania outperforming New York by 2%, but falling short of New Jersey and Delaware by more than 3%.
When divided into age categories for the provision of both any and preventive dental services, Pennsylvania exceeds the national rate for children aged 19-20. However, it trails every other age category by a range of 0.41% to 9.32%. Pennsylvania is on the right track to increase the numbers of eligible children receiving adequate dental care, but efforts must be intensified to reach and surpass the national average.
Participant Ratio
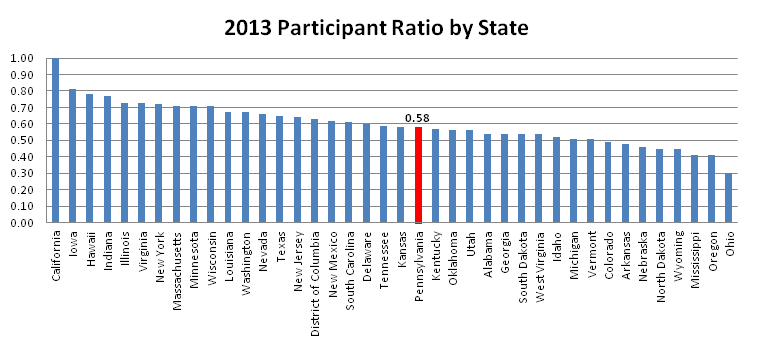
CMS utilizes two ratios in its EPSDT Participation Reports: participant and screening ratios. The participant ratio is calculated by dividing the number of children who received a comprehensive medical examination by the total number of children who should have received at least one examination. Disappointingly, Pennsylvania’s ratio has decreased since 2012 from 0.63 to 0.58. In other words, over 410,000 eligible children did not receive comprehensive examinations in 2013. Pennsylvania’s performance is now below the national 2013 average of 0.64, and it is ranked 22nd out of the 40 states and districts with published EPSDT Participation Reports. The participant ratios of New York, New Jersey and Delaware are all higher than Pennsylvania’s, at 0.72, 0.64 and 0.60 each. In fact, the ratios for each of those states rose as Pennsylvania’s fell. Pennsylvania effectively denied examinations to over 410,000 children, rendering them more vulnerable to physical, mental, developmental, dental, hearing, and vision morbidities.
Scrutinizing the participant ratio by age category reveals that children aged 10 and above are being screened at extremely low rates. Pennsylvania’s participant ratios for children under the age of 1 and between 1-2 years of age, 0.90 and 0.76 respectively, are on par with national averages. Its ratio for children between the ages of 6-9 is extremely commendable at 0.94. However, its ratios fall far below the national ratio for children in the age categories of 3-5, 10-14, 15-18, and 19-20, which are 0.62, 045, 0.40 and 0.23, respectively.
Screening Ratio
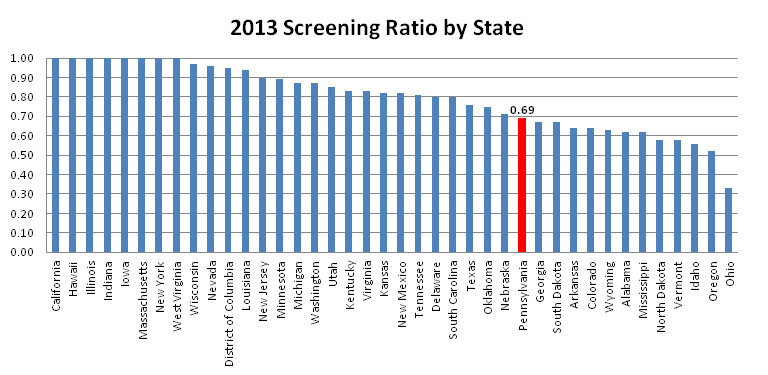
The second ratio published by CMS in the EPSDT Participation Report is the screening ratio, which is concerned with the absolute number of examinations, rather than the number of individuals receiving screenings. It is calculated by dividing the actual number of screenings the children were provided with by the number of screenings that all children enrolled in Medicaid should have received. Pennsylvania’s 2013 screening ratio was 0.69, which is significantly lower than 0.84, the national ratio, and Pennsylvania’s 2012 ratio of 0.77. Its ratio is also much lower than New York’s perfect ratio of 1.00, New Jersey’s 0.90 and Delaware’s 0.80. Over 380,000 expected examinations did not occur which could lead to serious health consequences for the 1,263,429 Pennsylvanian children who should be protected and screened by the EPSDT benefit program.
As with the participant ratio, scrutinizing the breakdown of screening ratio by age shows that Pennsylvania’s low ratio can mostly be attributed to screenings after the age of 10. The screening ratios for children aged 10-14, 15-18 and 19-20 are 0.47, 0.44 and 0.26, respectively. Another daunting statistic which helps explain the decline in Pennsylvania’s ratio is the drop for children under the age of 1, which deteriorated from 0.94 in 2012 to 0.82 in 2013. At a time when screenings are particularly important, Pennsylvania provided over 37,000 too few comprehensive medical examinations to newborns and infants under the age of 1. Together, the participant and screening ratios demonstrate that Pennsylvania has a two-pronged deficit in screenings. First, over a third of eligible children are not being examined, and second, there is an extreme shortage in the number of examinations being provided to low income children. Pennsylvania should work to raise future ratios back to and beyond the national average.
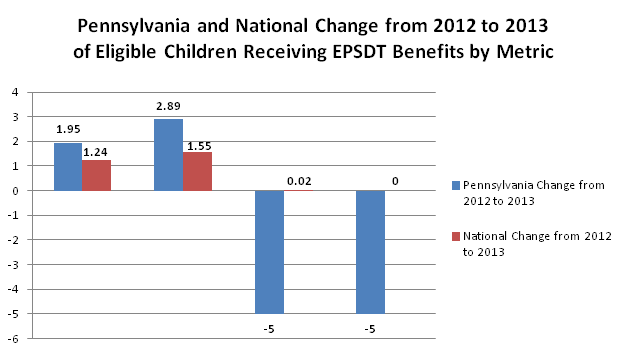
Trends in the Data
The four explored metrics paint a disturbing picture for children who should be receiving medical and dental examinations and treatment in Pennsylvania. Pennsylvania is below the already-low national average for each statistic. From 2012 to 2013, it only showed minimal improvement on two metrics, the provision of general and preventive dental services. Alarmingly, the participant and screening ratios significantly worsened. Pennsylvania is further marginalizing a set of children who face great needs due to their low-resource background.
Pennsylvania must take responsibility for the health care of children eligible for the Early Periodic Screening Diagnostic Treatment benefit program and provide each individual child with the health services to which they are entitled.
Notes
[1] Ms. Laskin is a rising senior at Haverford College and was a 2014 summer intern at the Public Interest Law Center of Philadelphia.
[2] See, http://mchb.hrsa.gov/epsdt/overview.html
[3] See, http://www.medicaid.gov/Medicaid-CHIP-Program-Information/By-Topics/Benefits/Early-and-Periodic-Screening-Diagnostic-and-Treatment.html
[4]42 U.S.C. § 1396 (d)(a)(4)(A). See, http://www.gpo.gov/fdsys/pkg/USCODE-2010-title42/pdf/USCODE-2010-title42-chap7-subchapXIX-sec1396d.pdf
[5] All data has been taken from Medicaid.gov’s Early and Periodic Screening, Diagnostic, and Treatment Participation Reports, and can be accessed at: http://www.medicaid.gov/MEDICAID-CHIP-Program-Information/By-Topics/Benefits/Early-and-Periodic-Screening-Diagnostic-and-Treatment.html
[6] See, http://www.medicaid.gov/Medicaid-CHIP-Program-Information/By-Topics/Benefits/Early-and-Periodic-Screening-Diagnostic-and-Treatment.html